Let’s plot some functions!
Let’s say I would like to read some sensor measurements and then display the results as a graph on the screen. Using pure QML for plotting is possible but probably too slow for bigger amounts of data. So how about creating the plot from the C++ side? Turns out it is not that difficult.
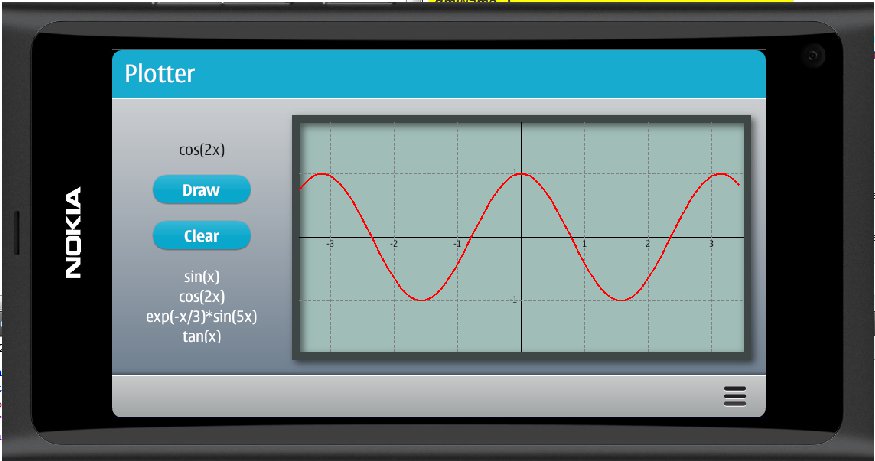
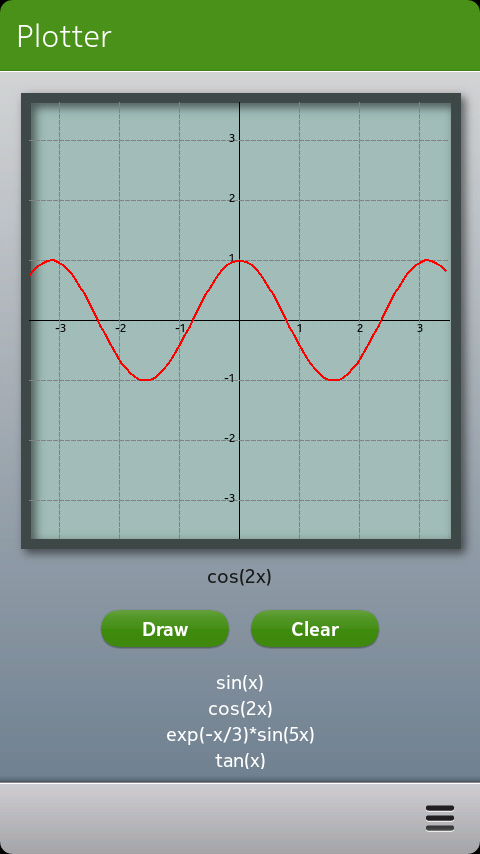
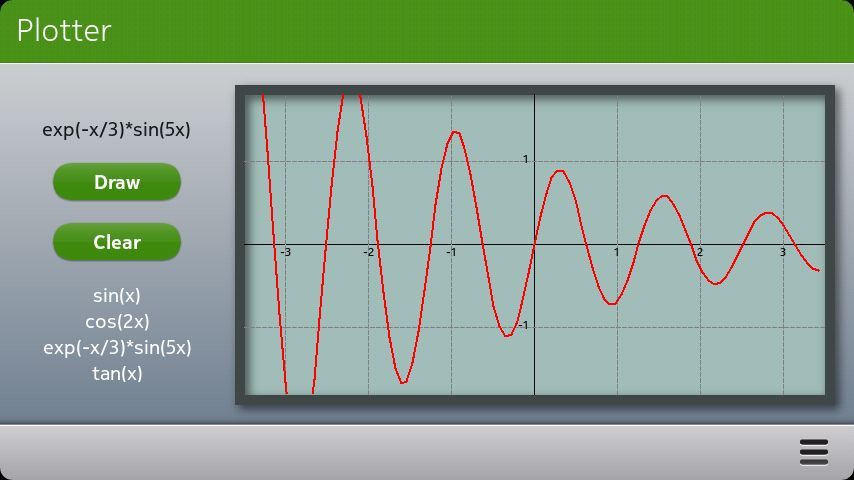
Here is my first application that uses a custom made QML component. Below are screenshots of the application running on N9 in portrait and in landscape mode. For testing purposes I created a listview with a set of predefined function names. By selecting one of the functions and clicking the Draw button the function name will be passed to the custom graph component that will then draw the function to the screen.
Creating the plot area images
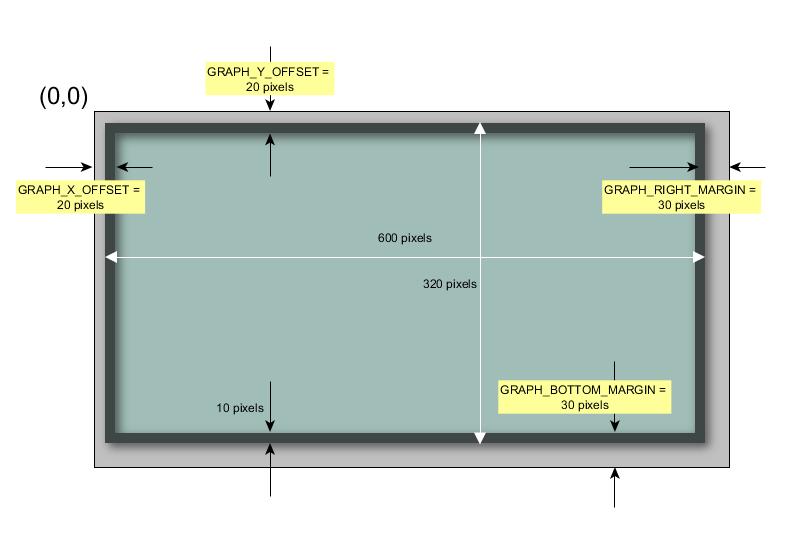
As the first step I created the plot figures with GIMP, one for the portrait mode and one for the landscape mode. The figure below shows the dimensions for the landscape mode. Creating the figure in GIMP requires just a couple of simple steps:
- Create a new image with the size 600×320 pixels. Add a selection rectangle that will cover the whole image (use the Tool Options box if needed, there you can set the exact position and size for the selection rectangle).
- Shrink the selection (Select>Shrink) by 10 pixels and fill the plot area with color RGB(161,189,184).
- Create the border by inverting the selection (Select>Invert) and fill with the color RGB(63,71,70).
- Create a drop shadow from the border (Filters>Light and Shadow>Drop Shadow…). I set Offset X=4, Offset Y=4, Blur Radius=15. This will enlarge the image so that the final size will be 630×350 pixels.
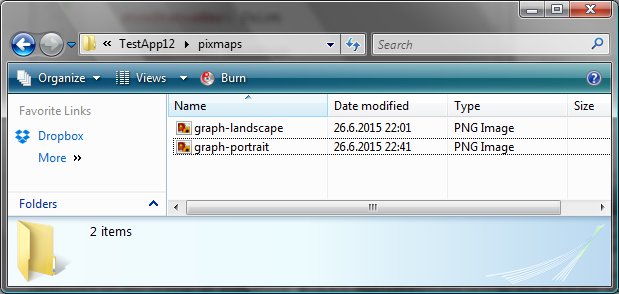
- Export the image (File>Export…) to a PNG file graph-landscape.png.
Repeat the steps for the portrait image, the initial image size is 440×456 pixels. Export the image to graph-portrait.png.
Creating the Graph QML component
You can create your own QML components in QtCreator in a pretty straightforward manner. Basically you will need to create a class based on the QDeclarativeItem base class and then register the class in the main() function. You can add properties and functions that can be accessed from the QML side just like with any standard QML component.
So let’s start by creating a new Qt Quick Application in QtCreator. I’ll name the project TestApp12 and select Qt Quick Components for Meego/Harmattan and set Qt Simulator and Harmattan as targets. As a result we should have the standard set of source files (main.cpp, main.qml and MainPage.qml).
Next let’s create a new class called Graph: right click Sources in the Projects pane and select Add New…>C++>C++ Class. The base class should be QDeclarativeItem.
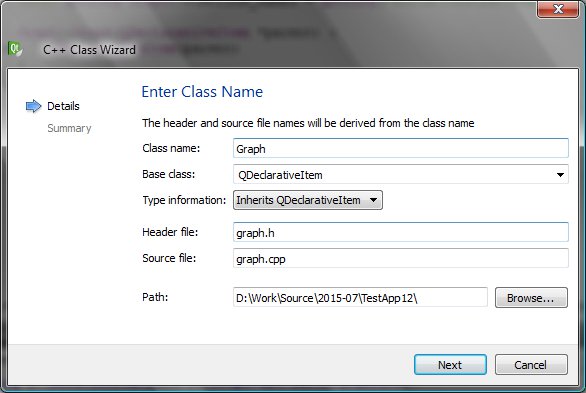
The header file graph.h is shown below after adding all the necessary definitions. The header files (QPainter, QStyleOptionGraphicsItem, QPen and QPixmap) enable us to draw to the screen. In addition, qmath.h is added to get access to the trigonometric functions.
The class declaration itself contains the standard Q_OBJECT macro call and two property declarations (funcName, inPortrait). For each property we will need to assign three functions (the function names are prefixed with READ, WRITE and NOTIFY in the property declaration).
Note that there are also three ordinary member functions (draw, clear and theFunctions) that are made callable from the QML side with the Q_INVOKABLE macro.
Finally the private section contains declarations for all the member functions needed to draw the coordinate axes (drawAxes, drawXAxis, drawYAxis), to draw the plot area (drawPixmap) and the grid (drawGrid) and to draw the selected function (drawGraph).
A few constants are defined to locate the drawing area inside the pixmap (see also the figure above). The variable ‘values’ will contain the calculated function (x,y) values and the variable ‘points’ will contain the corresponding screen pixel numbers.
#ifndef GRAPH_H
#define GRAPH_H

#include <QDeclarativeItem>
#include <QPainter>
#include <QStyleOptionGraphicsItem>
#include <QPen>
#include <QPixmap>
#include <QtCore/qmath.h>

class Graph : public QDeclarativeItem
{
    Q_OBJECT
    Q_PROPERTY(QString funcName READ getFuncName WRITE setFuncName
               NOTIFY funcNameChanged)
    Q_PROPERTY(bool inPortrait READ getInPortrait WRITE setInPortrait NOTIFY inPortraitChanged)

public:
    Graph(QDeclarativeItem *parent = 0);
    void paint(QPainter *,
               const QStyleOptionGraphicsItem *,
               QWidget *);
    QString getFuncName();
    void setFuncName(QString funcName);
    bool getInPortrait();
    void setInPortrait(bool setP);
    Q_INVOKABLE void draw();
    Q_INVOKABLE void clear();
    Q_INVOKABLE QString theFunctions();

signals:
    void funcNameChanged();
    void inPortraitChanged();

public slots:

private:
    void drawAxes(QPainter *painter);
    void drawXAxis(QPainter *painter, qreal xMin, qreal xMax);
    void drawYAxis(QPainter *painter, qreal yMin, qreal yMax);
    void drawGraph(QPainter *painter);
    void drawPixmap(QPainter *painter);
    void drawGrid(QPainter *painter,qreal xMin, qreal xMax, qreal yMin, qreal yMax);

    static const int N_POINTS = 100;
    bool functionIsSelected;
    bool drawingIsEnabled;
    QString funcName;

    static const QString IMAGE_FILE_PORTRAIT;
    static const QString IMAGE_FILE_LANDSCAPE;
    static const QString FUNCTION_NAMES;

    static const int GRAPH_X_OFFSET = 20;
    static const int GRAPH_Y_OFFSET = 20;
    static const int GRAPH_RIGHT_MARGIN = 30;
    static const int GRAPH_BOTTOM_MARGIN = 30;

    QPixmap *pixmap,pixmapPortrait,pixmapLandscape;
    QPen pen;

    bool inPortrait;

    // graph area position inside the pixmap
    int graphX, graphY, graphW, graphH;

    // coordinate system
    static const qreal X_MIN=-3.5, X_MAX=3.5;
    qreal yMin, yMax;  // depend on the aspect ratio
    qreal xWidth;
    qreal yWidth;

    // points to draw (pixel numbers: px,py)
    QPointF points[N_POINTS];

    // function values (real: x,y)
    qreal values[N_POINTS][2];

};

#endif // GRAPH_H
The Graph class implementation (graph.cpp) is shown below. First some constants are defined to locate the plot area pixmaps (created with GIMP and exported to PNG files). The pixmaps will be stored into a resource file for easy access. The FUNCTION_NAMES constant defines the available functions that this component can draw. The QML code can query the function names by calling the function theFunctions.
The class constructor will initialize the class variables and load the pixmaps. Please note that you must also call the setFlag function and set the flag QGraphicsItem::ItemHasNoContents to false. Otherwise this component cannot draw anything.
The component will draw itself to the screen in the paint function. The paint function will be called when the component is instantiated. You can also ask the UI to call the paint function later on by calling the update function (e.g. when we have drawn the plot or when we want to clear the plot). As the first argument the paint function will get a pointer to a QPainter object which contains all the necessary tools for drawing to the screen. The paint function is quite simple. It will first save the painter state, then draw the function and finally restore the painter state.
Next the property functions are implemented. There is a setter and a getter function for each property. The signal function doesn’t need to be implemented as we already know.
The draw function calculates the function values for a fixed x-value range (which depends on the device orientation and the number of points – defined with the N_POINTS constant). The rest of the file contains mainly the routines for drawing the pixmap, the coordinate axes and the grid. All pretty straightforward. One thing to note about the drawing coordinates though: in QML you can define the (x,y) position for the custom component (=top-left corner) but inside the component the coordinates are relative so that the top-left corner is always (0,0).
#include "graph.h"

const QString Graph::IMAGE_FILE_PORTRAIT = QString(":/pixmaps/graph-portrait.png");
const QString Graph::IMAGE_FILE_LANDSCAPE = QString(":/pixmaps/graph-landscape.png");
const QString Graph::FUNCTION_NAMES = QString("sin(x);cos(2x);exp(-x/3)*sin(5x);tan(x)");

Graph::Graph(QDeclarativeItem *parent) :
    QDeclarativeItem(parent)
{
    functionIsSelected = false;
    drawingIsEnabled = false;
    inPortrait = false;

    funcName = "";

    pixmapPortrait.load(IMAGE_FILE_PORTRAIT);
    pixmapLandscape.load(IMAGE_FILE_LANDSCAPE);

    setFlag(QGraphicsItem::ItemHasNoContents, false);
}

// Draw coordinate axes and the points from allValues
void Graph::paint(QPainter *painter,
                  const QStyleOptionGraphicsItem *option, QWidget *widget)
{

    painter->save();
    drawPixmap(painter);
    drawAxes(painter);

    if(drawingIsEnabled)
        drawGraph(painter);

    painter->restore();
}

QString Graph::getFuncName()
{
    return(funcName);
}

void Graph::setFuncName(QString fName)
{
    functionIsSelected = true;
    if (funcName!=fName) {
        funcName = fName;
        emit funcNameChanged();
    }
}

bool Graph::getInPortrait()
{
    return(inPortrait);
}

void Graph::setInPortrait(bool setP)
{
    if (inPortrait!=setP) {
        inPortrait = setP;
        emit inPortraitChanged();
    }
}

// Calculate y=f(x) and call update to refresh the graph
void Graph::draw()
{
    qreal x,y;

    if(!functionIsSelected)
        return;

    for (int iPoint=0;iPoint<N_POINTS;iPoint++)
    {
        x = X_MIN + iPoint*(xWidth/N_POINTS);
        if(funcName=="sin(x)")
            y = qSin(x);
        else if(funcName=="cos(2x)")
            y = qCos(2*x);
        else if(funcName=="exp(-x/3)*sin(5x)")
            y = qExp(-x/3)*qSin(5*x);
        else if(funcName=="tan(x)")
            y = qTan(x);
        else
            return;
        values[iPoint][0]=x;
        values[iPoint][1]=y;
    }
    drawingIsEnabled = true;
    update();
}

void Graph::clear()
{
    functionIsSelected = false;
    drawingIsEnabled = false;
    update();
}

QString Graph::theFunctions()
{
    return(FUNCTION_NAMES);
}

void Graph::drawGrid(QPainter *painter, qreal xMin, qreal xMax, qreal yMin, qreal yMax)
{
    QPen gridPen, textPen;

    int yLo = (yMin>=0)?qFloor(yMin):qCeil(yMin);
    int yHi = (yMax>=0)?qFloor(yMax):qCeil(yMax);

    gridPen.setStyle(Qt::DashLine);
    gridPen.setColor(Qt::darkGray);

    textPen.setStyle(Qt::SolidLine);
    textPen.setColor(Qt::black);

    QFont font;
    font.setPixelSize(12);
    painter->setFont(font);

    int xCenter = graphX + graphW/2;
    int yCenter = graphY + graphH/2;
    int textWidth = 40;
    int textHeight = 20;
    int textMargin = 5;

    // horizontal grid lines with 1.0 spacing
    for (int y=yLo;y<=yHi;y=y+1)
    {
        if(y==0)
            continue;

        int x1 = xCenter + qRound(xMin/xWidth*graphW);
        int y1 = yCenter - qRound(y/yWidth*graphH);
        int x2 = xCenter + qRound(xMax/xWidth*graphW);
        int y2 = y1;
        painter->setPen(gridPen);
        painter->drawLine(x1,y1,x2,y2);
        // Y-axis numbering
        QRectF textBox(xCenter-textWidth-textMargin,y1-textHeight/2,textWidth,textHeight);
        painter->setPen(textPen);
        painter->drawText(textBox,Qt::AlignRight,QString("%1").arg(y));
    }

    // vertical grid lines with 1.0 spacing
    int xLo = (xMin>=0)?qFloor(xMin):qCeil(xMin);
    int xHi = (xMax>=0)?qFloor(xMax):qCeil(xMax);
    for (int x=xLo;x<=xHi;x=x+1)
    {
        if(x==0)
            continue;

        int x1 = xCenter + qRound(x/xWidth*graphW);
        int y1 = yCenter - qRound(yMin/yWidth*graphH);
        int x2 = x1;
        int y2 = yCenter - qRound(yMax/yWidth*graphH);
        painter->setPen(gridPen);
        painter->drawLine(x1,y1,x2,y2);
        // X-axis numbering
        QRectF textBox(x1-textWidth/2,yCenter,textWidth,textHeight);
        painter->setPen(textPen);
        painter->drawText(textBox,Qt::AlignHCenter,QString("%1").arg(x));
    }

    pen.setStyle(Qt::SolidLine);
    pen.setColor(Qt::black);
    painter->setPen(pen);
}

void Graph::drawXAxis(QPainter *painter, qreal xMin, qreal xMax)
{
    int x1 = graphX + graphW/2 + qRound(xMin/xWidth*graphW);
    int y1 = graphY + graphH/2;
    int x2 = graphX + graphW/2 + qRound(xMax/xWidth*graphW);
    int y2 = y1;
    painter->drawLine(x1,y1,x2,y2);
}

void Graph::drawYAxis(QPainter *painter, qreal yMin, qreal yMax)
{
    int x1 = graphX + graphW/2;
    int y1 = graphY + graphH/2 - qRound(yMin/yWidth*graphH);
    int x2 = x1;
    int y2 = graphY + graphH/2 - qRound(yMax/yWidth*graphH);
    painter->drawLine(x1,y1,x2,y2);
}

void Graph::drawGraph(QPainter *painter)
{
    pen.setColor(Qt::red);
    pen.setWidth(2);
    painter->setPen(pen);

    painter->setClipRect(graphX,graphY,graphW,graphH);

    // map the points into the coordinate system
    for (int iPoint=0;iPoint<N_POINTS;iPoint++)
    {
        qreal x = values[iPoint][0];
        qreal y = values[iPoint][1];
        // map from coordinate system to paint area
        int pX = graphX + graphW/2 + qRound(x/xWidth*graphW);
        int pY = graphY + graphH/2 - qRound(y/yWidth*graphH);
        points[iPoint]=QPointF(pX,pY);
    }
    painter->drawPolyline(points,N_POINTS);
}

void Graph::drawPixmap(QPainter *painter)
{
    pixmap = (inPortrait)?&pixmapPortrait:&pixmapLandscape;

    painter->drawPixmap(0,0,*pixmap);

    graphX = GRAPH_X_OFFSET;
    graphY = GRAPH_Y_OFFSET;
    graphW = pixmap->width()-GRAPH_X_OFFSET-GRAPH_RIGHT_MARGIN;
    graphH = pixmap->height()-GRAPH_Y_OFFSET-GRAPH_BOTTOM_MARGIN;

    // Calculate y-axis limits based on the x-axis width and
    // the graph window aspect ratio
    xWidth = X_MAX-X_MIN;
    yWidth = xWidth/graphW*graphH;
    yMin = -yWidth/2;
    yMax = yWidth/2;
}

void Graph::drawAxes(QPainter *painter)
{
    pen.setColor(Qt::black);
    pen.setWidth(0);
    painter->setPen(pen);
    drawXAxis(painter,X_MIN,X_MAX);
    drawYAxis(painter,yMin,yMax);
    drawGrid(painter,X_MIN,X_MAX,yMin,yMax);
}
After adding the Graph class the project should compile without errors.
Registering the QML component
To be able to use the Graph component in our QML files we need to register it in the main function. This is done by calling the qmlRegisterType function with 4 parameters: the library name (“Graph”), major version number (1), minor version number (0) and the component name (“Graph”). In addition the class name should be provided as a template parameter. And the graph.h header should be included.
#include <QtGui/QApplication>
#include "qmlapplicationviewer.h"
#include "graph.h"

Q_DECL_EXPORT int main(int argc, char *argv[])
{
    QScopedPointer<QApplication> app(createApplication(argc, argv));

    QmlApplicationViewer viewer;
    qmlRegisterType<Graph>("Graph", 1, 0, "Graph");

    viewer.setOrientation(QmlApplicationViewer::ScreenOrientationAuto);
    viewer.setMainQmlFile(QLatin1String("qml/TestApp12/main.qml"));
    viewer.showExpanded();

    return app->exec();
}
After this addition the project should still compile just fine. And we are now ready to move on to the QML part.
Storing the pixmaps into a resource file
But before entering the QML world there is one more thing to do. We must store the PNG images somewhere to be able to draw them. I will use a resource file for that purpose so that I don’t need to bother with file paths. However, first I will create a folder called pixmaps into the project folder and copy the PNG files there.
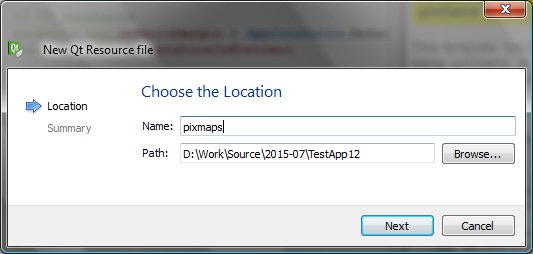
Then in QtCreator I will add a new resource file by right clicking the project name entry in the Projects pane and selecting Add new…>Qt>Qt Resource File. I’ll name the resource file pixmaps.
QtCreator will create an empty resource file and open it. First we will need to add a prefix (Add>Add Prefix). I’ll use just the root (“/”) prefix. Then we can add the PNG files (Add>Add Files) from the pixmaps folder.
Using the Graph component
The main.qml file is shown below. I will basically use the same appConstants.js file as in the color scheme tester to define all the UI constants. I will use the property orientationIsPortrait to notify the Graph component about the orientation change.
import QtQuick 1.1
import com.nokia.meego 1.0
import "appConstants.js" as AppConstants

PageStackWindow {
    id: appWindow

    // UI constants
    property int defaultMargin : AppConstants.DefaultMargin
    property bool orientationIsPortrait

    // Select the color scheme before instantiating any QML elements
    // that need the color...
    onDefaultMarginChanged: theme.colorScheme = AppConstants.colorScheme

    showStatusBar: false

    initialPage: mainPage

    MainPage {
        id: mainPage
    }

    ToolBarLayout {
        id: commonTools
        visible: true
        ToolIcon {
            platformIconId: "toolbar-view-menu"
            anchors.right: (parent === undefined) ? undefined : parent.right
            onClicked: (myMenu.status === DialogStatus.Closed) ? myMenu.open() : myMenu.close()
        }
    }

    Menu {
        id: myMenu
        visualParent: pageStack
        MenuLayout {
            MenuItem {
                text: qsTr("Quit")
                onClicked: Qt.quit()
            }
        }
    }

    // Adjust orientation dependent variables
    onInPortraitChanged: {
        orientationIsPortrait = inPortrait
    }

}
For completeness sake here is also the appConstants.js file. Note the colorScheme selection on line 5. This is a java library and it can be added to project by right clicking the QML entry in the Projects pane and selecting Add New…>QML>JS File>appConstants. After the library has been added the import statement in the beginning of the main.qml file should work (and the editor should not show any red underlining).
// Application specific UI constants

.pragma library

var colorScheme = 3;

var DefaultMargin = 16;
var RadioButtonSpacing = 24;

var HeaderDefaultHeightPortrait = 72;
var HeaderDefaultTopSpacingPortrait = 15;
var HeaderDefaultBottomSpacingPortrait = 15;

var HeaderDefaultHeightLandscape = 64;
var HeaderDefaultTopSpacingLandscape = 9;
var HeaderDefaultBottomSpacingLandscape = 13;

var fontFamily = "Nokia Pure Text Light";
var fontSizeLarge = 32;
var fontSizeSmall = 24;
var fontFamilyButton = "Nokia Pure Text"
var fontSizeButton = 20;
Then Header.qml file defines the page header. This is also based on the color scheme tester.
import QtQuick 1.1
import com.nokia.meego 1.0
import "appConstants.js" as AppConstants

Item {

    property alias headerText: titleLabel.text
    property string viewHeader: "image://theme/color"+theme.colorScheme+"-meegotouch-view-header-fixed"

    property int headerTopSpacing : (inPortrait)?AppConstants.HeaderDefaultTopSpacingPortrait:
                         AppConstants.HeaderDefaultTopSpacingLandscape
    property int headerBottomSpacing : (inPortrait)?AppConstants.HeaderDefaultBottomSpacingPortrait:
                         AppConstants.HeaderDefaultBottomSpacingLandscape

    property string headerFontFamily : AppConstants.fontFamily
    property int headerFontSize : AppConstants.fontSizeLarge
    // header dimensions
    height: (inPortrait)?AppConstants.HeaderDefaultHeightPortrait:
                          AppConstants.HeaderDefaultHeightLandscape
    width: parent.width

    // Header background image
    Image {
        id: titleImage
        height: parent.height
        width: parent.width
        source: viewHeader
    }

    // Define the label styling
    LabelStyle {
        id: labelStyle
        textColor: "white"
        fontFamily: headerFontFamily
        fontPixelSize: headerFontSize
    }

    // Header text
    Label {
        id: titleLabel
        platformStyle: labelStyle
        anchors {
            top:parent.top; topMargin:headerTopSpacing;
            bottom:parent.bottom; bottomMargin:headerBottomSpacing;
            left:parent.left; leftMargin:defaultMargin
        }
    }
}
And finally here is the MainPage.qml file that defines the user interface for this application. After registering the Graph class in the main.cpp we can now import our own QML component library.
In the beginning of the file there are some property definitions that mainly set the button characteristics taking also into account the chosen color scheme. Then we will construct the page with a background (id:wallpaper), a header (id:header), our Graph component (id:graph), a label for the function name (id:label), two buttons (id:drawButton & clearButton), a list of function names (id:listView) and a delegate for the ListView component (id:listDelegate). Note that the delegate will set the funcName property of the Graph component to tell the Graph what to draw. And the ListView component will populate the list of available function names by simply calling the graph.theFunctions and assigning the split result into the model property.
The two buttons are placed inside a Grid element so that we can rearrange the buttons depending on the current device orientation (using the Grid rows and columns properties).
import QtQuick 1.1
import com.nokia.meego 1.0
import "appConstants.js" as AppConstants
import Graph 1.0

Page {
    // Button styling
    property string buttonBackground: "image://theme/color"+theme.colorScheme+"-meegotouch-button-accent-background"
    property string buttonFontFamily : AppConstants.fontFamilyButton
    property int buttonFontSize : AppConstants.fontSizeButton
    // Number of button columns (depends on the page orientation)
    property int nColumns
    // Function name prompt
    property string promptFontColor : "black"
    property string promptText: "Please select a function"

    tools: commonTools

    // Gradient page background
    Rectangle {
        id: wallpaper
        gradient: Gradient {
            GradientStop {
                position: 0.000
                color: "gainsboro"
            }
            GradientStop {
                position: 1.000
                color: "slategray"
            }
        }
        anchors.fill: parent
    }

    // The page header
    Header {
        id: header
        headerText: "Plotter"
    }

    // Define the button styling
    ButtonStyle {
        id: buttonStyle
        textColor: "white"
        fontFamily: buttonFontFamily
        fontPixelSize: buttonFontSize
        background: buttonBackground
        pressedBackground: buttonBackground+"-pressed"
    }

    // Plotting area (a custom QML component)
    // Change in orientationIsPortrait property will trigger graph update
    Graph {
        id: graph
        inPortrait: orientationIsPortrait
        x: (inPortrait)?10:224
        y: (inPortrait)?82:74
    }

    // Selected function name
    Label {
        id: label
        text: promptText
        font.pixelSize: 20
        anchors.bottom: buttonGroup.top
        anchors.bottomMargin: 20
        anchors.horizontalCenter: buttonGroup.horizontalCenter
    }

    // Draw and Clear buttons
    Grid {
        x: (inPortrait)?parent.width/2-buttonGroup.width/2:117-buttonGroup.width/2
        y: (inPortrait)?parent.height-153-buttonGroup.height/2:
                         parent.height/2-buttonGroup.height/2
        id: buttonGroup
        anchors.topMargin: 50
        spacing: 20
        columns: (inPortrait)?2:1
        rows: (inPortrait)?1:2
        Button{
            id: drawButton
            width: 130
            height: 40
            platformStyle: buttonStyle
            text: "Draw"
            onClicked: {
                graph.draw() // QT_INVOKABLE
            }
        }
        Button {
            id: clearButton
            width: 130
            height: 40
            platformStyle: buttonStyle
            text: "Clear"
            onClicked: {
                label.text=promptText
                graph.clear() // QT_INVOKABLE
            }
        }
    }
    // Function name list
    Rectangle {
        id: background
        color: "transparent"
        height: 100
        anchors.top:buttonGroup.bottom
        anchors.topMargin: 20
        anchors.horizontalCenter: buttonGroup.horizontalCenter
        width: 2*buttonGroup.width
    }
    ListView {
        id: listView
        model: graph.theFunctions().split(";")
        delegate: listDelegate
        anchors.fill: background
        clip: true
    }
    Component {
        id: listDelegate
        Text {
            text: modelData
            width: background.width
            font.pixelSize: 20
            horizontalAlignment: Text.AlignHCenter
            color: "white"
            MouseArea {
                anchors.fill: parent
                onClicked: {
                    label.text=modelData
                    graph.funcName=modelData
                }
            }
        }
    }
}
The color scheme can be changed easily by editing the appConstant.js file. And the application runs just fine in the simulator.